Graphene Trace
Pressure mapping data that clinicians can actually read.
A web application for a pressure sensor product, with a Django back end, React front end, role-based access and alerts for high-pressure regions. MSc coursework for Advanced Web Solutions.
The brief
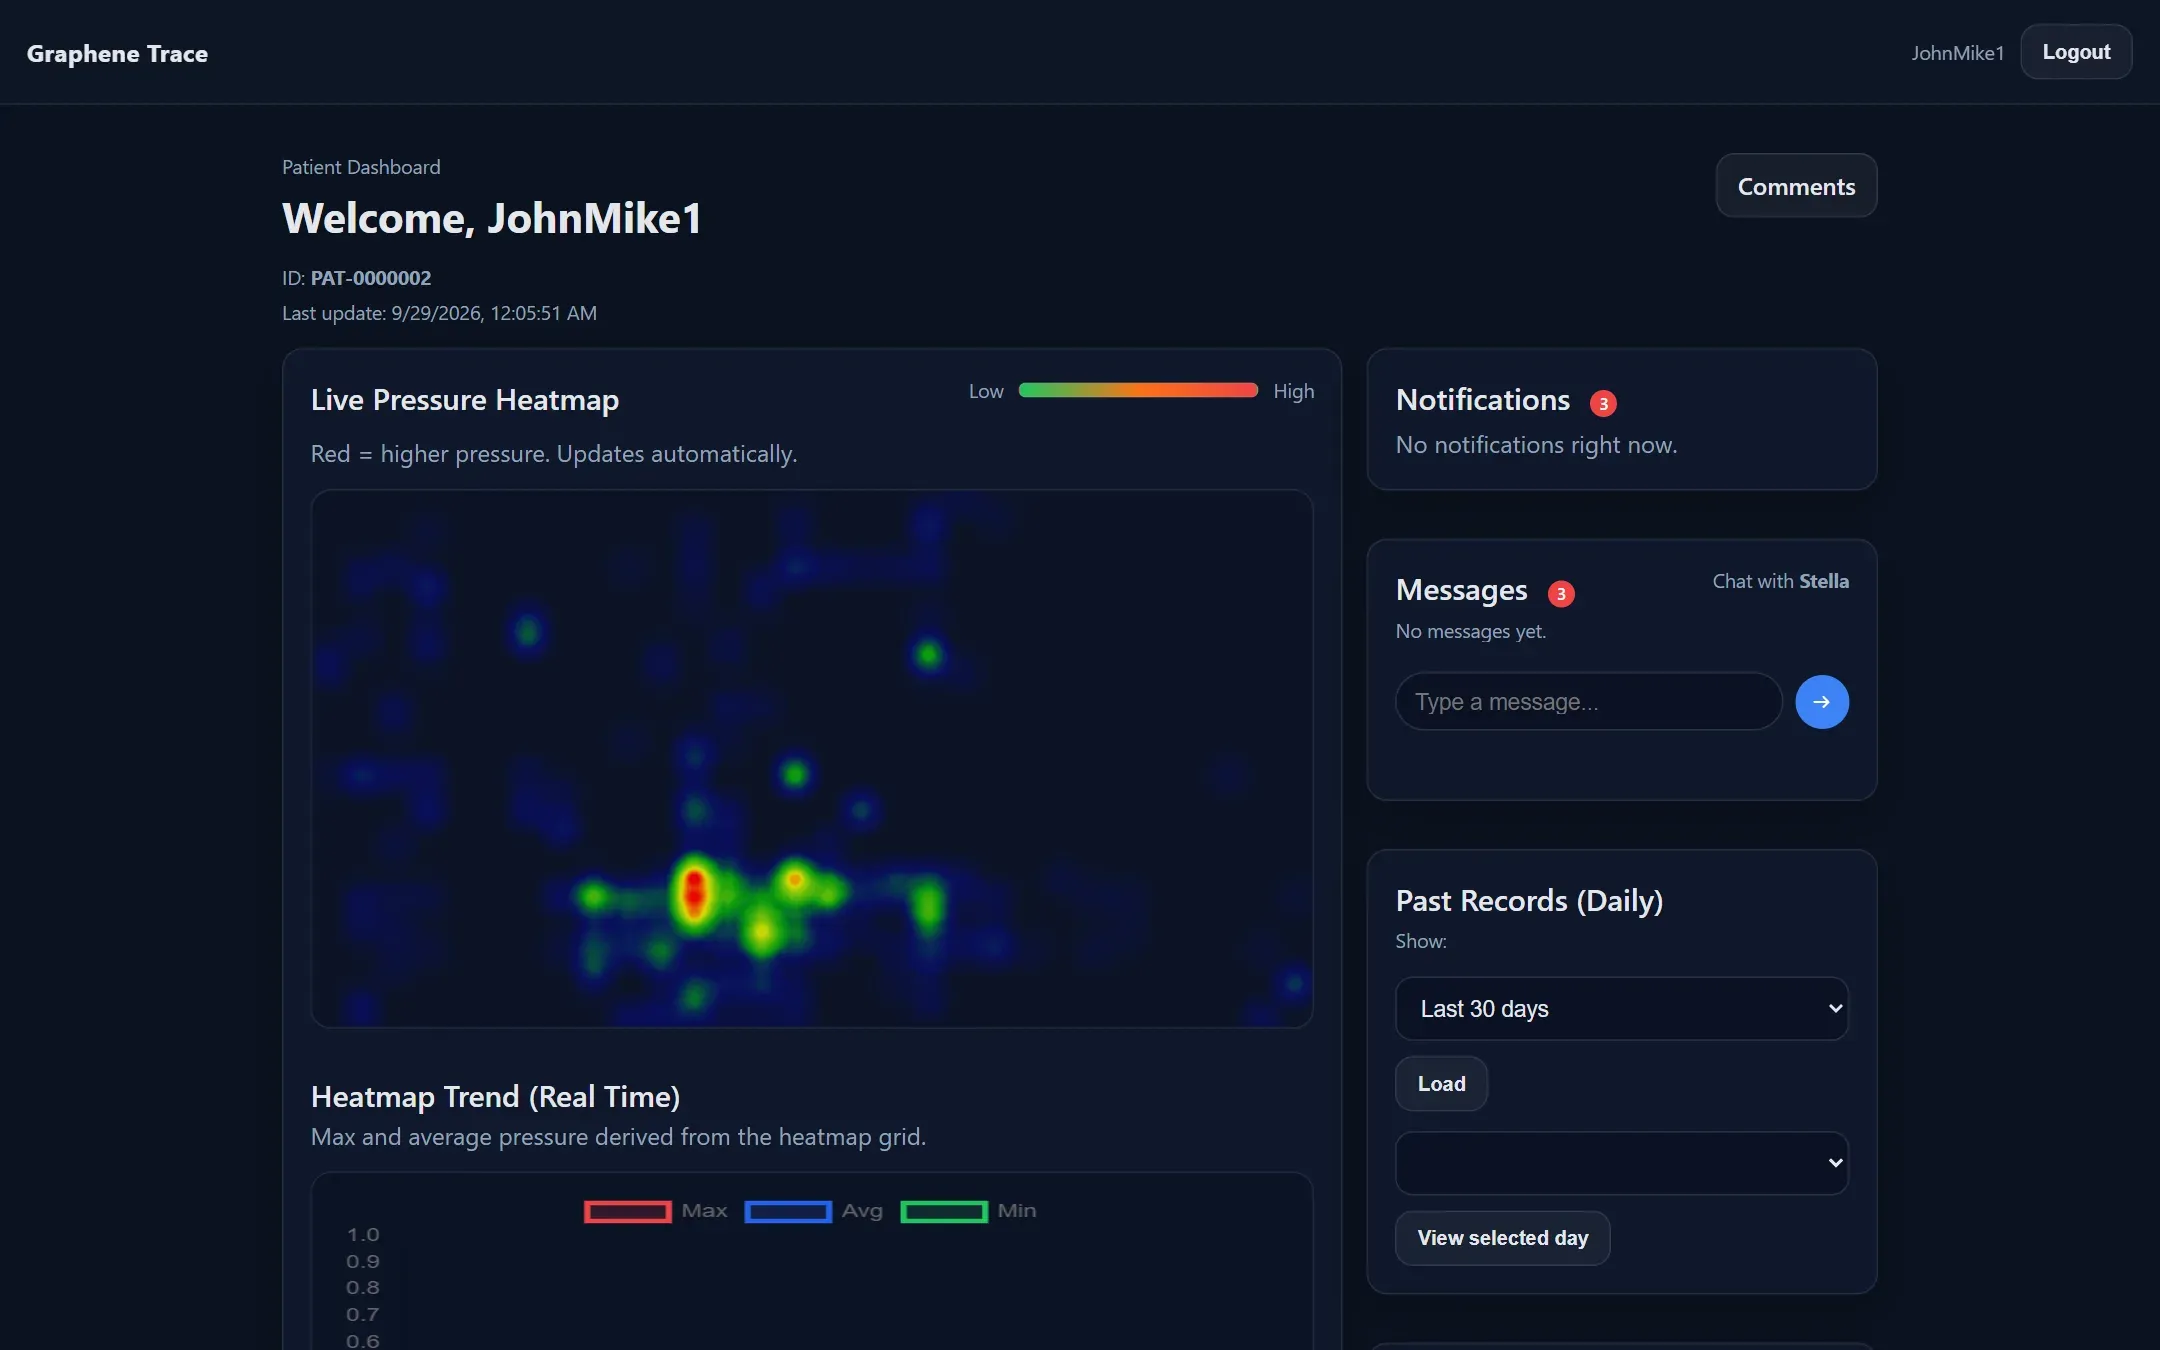
Graphene Trace is a MedTech startup whose sensors produce pressure maps: a 32×32 grid of readings, captured over time. A grid of numbers is useless to a busy clinician. The job was to turn it into something they could act on.
What it does
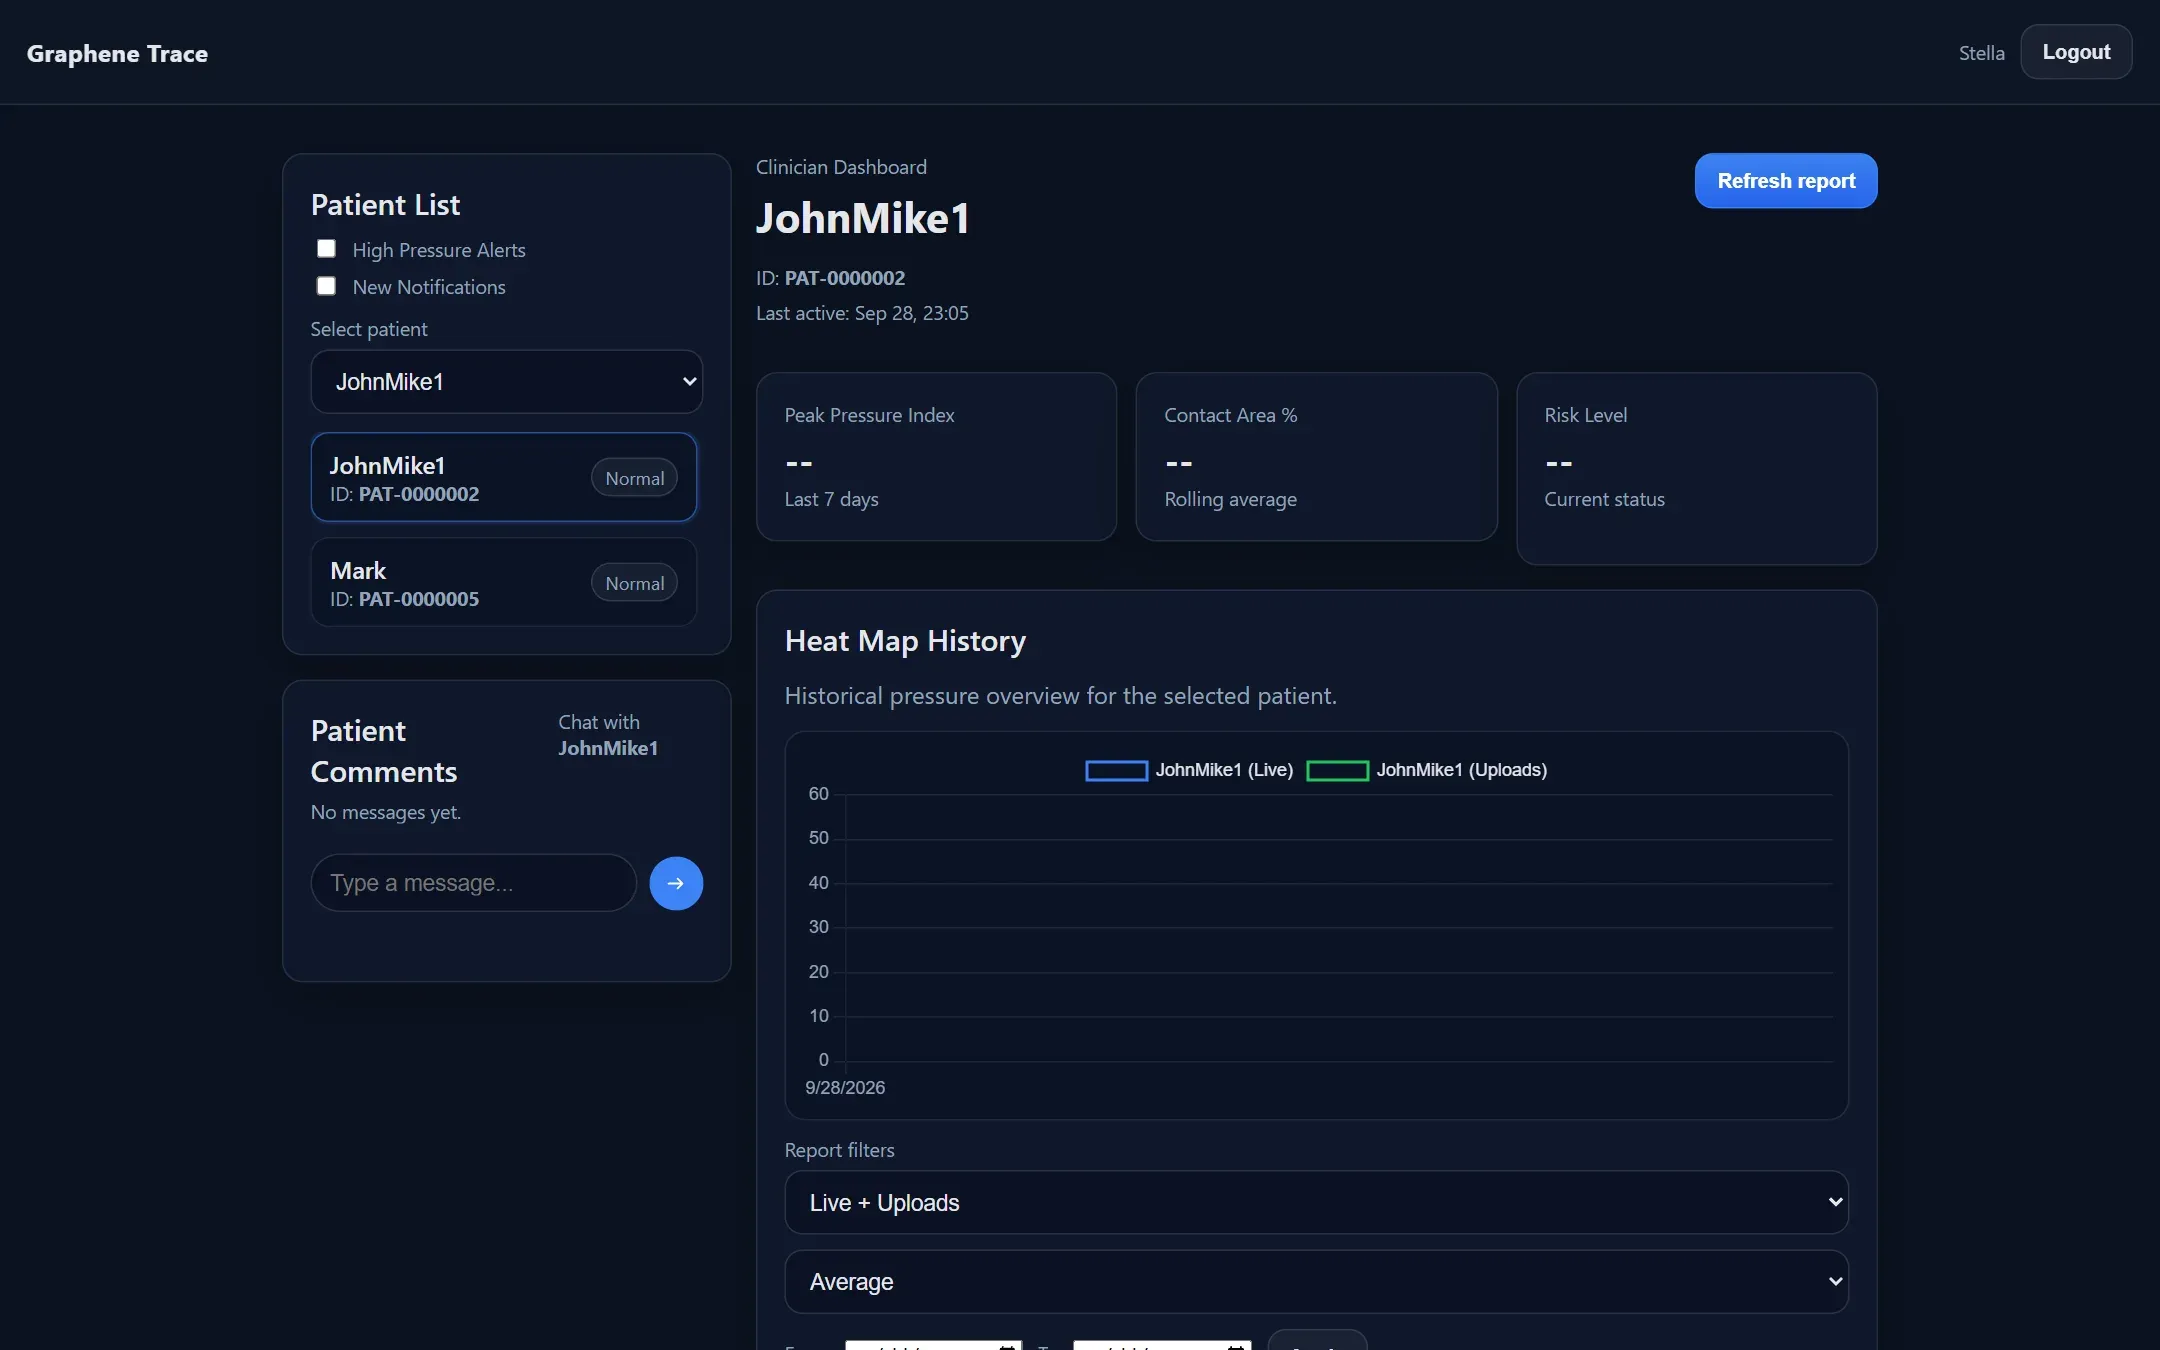
- Heatmaps and metrics for each recording, so high-pressure areas jump out.
- Alerts when a region stays above a safe threshold.
- Role-based access for three kinds of user: patient, clinician and admin. Each sees only what they need.
- Comments tied to timestamps, so a clinician can flag the exact moment something went wrong.
- Reports that can be generated for clinical review.
My part
I designed the database schema (the ERD covers users, sensor frames, alerts, metrics and comments), built the application with a Django back end and React front end, and wrote the technical report.
The report also covers user stories, wireframes and testing for each feature, including login validation with correct and incorrect credentials.